
 Facebook
 X
X
 Pinterest
 Copy Link
Colorado Real Estate Market Update


The following analysis of the Metro Denver & Northern Colorado real estate market is provided by Windermere Real Estate Chief Economist Matthew Gardner. We hope that this information may assist you with making better-informed real estate decisions. For further information about the housing market in your area, please don’t hesitate to contact your Windermere agent.
ECONOMIC OVERVIEW
What a difference a quarter makes! Following the massive job losses Colorado experienced starting in February—the state shed over 342,000 positions between February and April—the turnaround has been palpable. Through August, Colorado has recovered 178,000 of the jobs lost due to COVID-19, adding 107,500 jobs over the past three months, an increase of 4.2%. All regions saw a significant number of jobs returning. The most prominent was in the Denver metropolitan service area (MSA), where 78,800 jobs returned in the quarter.
Although employment in all markets is recovering, there is still a way to go to get back to pre-pandemic employment levels. The recovery in jobs has naturally led the unemployment rate to drop: the state is now at a respectable 6.7%, down from a peak of 12.2%. Regionally, all areas continue to see their unemployment rates contract. I would note that the Fort Collins and Boulder MSA unemployment rates are now below 6%. Cases of COVID-19 continue to rise, which is troubling, but rising rates have only slowed—not stopped—the economic recovery. Moreover, it has had no noticeable impact on the state’s housing market.
HOME SALES
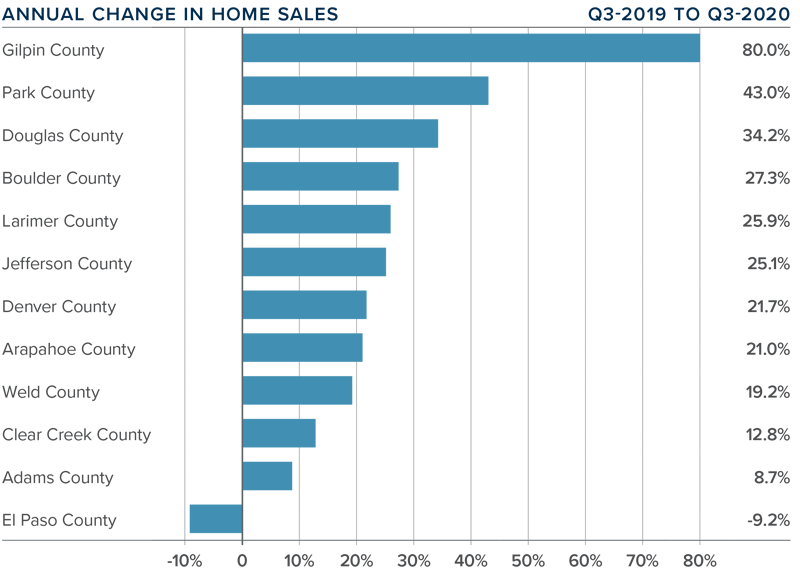
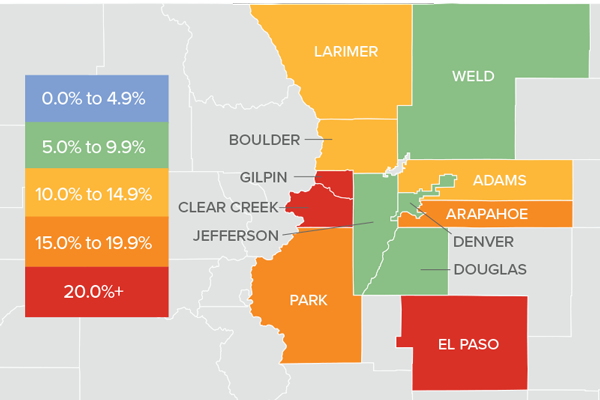
- In the third quarter of 2020, 15,065 homes sold. This represents an increase of 20.4% over the third quarter of 2019, and a remarkable 52.7% increase over the second quarter of this year.
- Home sales rose in all markets other than El Paso compared to the second quarter of 2019. I believe sales are only limited by the number of homes on the market.
- Inventory levels remain remarkably low, with the average number of homes for sale down 44.5% from the same period in 2019. Listing activity was 17.8% lower than in the second quarter of 2020.
- Even given the relative lack of inventory, pending sales rose 17.8% from the second quarter, suggesting that closings for the final quarter of the year will be positive.
HOME PRICES
- After taking a pause in the second quarter, home prices rose significantly in the third quarter, with prices up 11.9% year-over
 -year to an average of $523,193. Prices were up 7.4% compared to the second quarter of this year.
 - Interest rates have been dropping. Although I do not see there being room for them to drop much further, they are unlikely to rise significantly. This is allowing prices to rise at above-average rates.
- Year-over-year, prices rose across all markets covered by this report. El Paso, Clear Creek, and Gilpin counties saw significant price appreciation. All but four counties saw double-digit price gains.
- Affordability in many Colorado markets remains a concern, as prices are rising at a faster pace than mortgage rates have been dropping.
 -year to an average of $523,193. Prices were up 7.4% compared to the second quarter of this year.
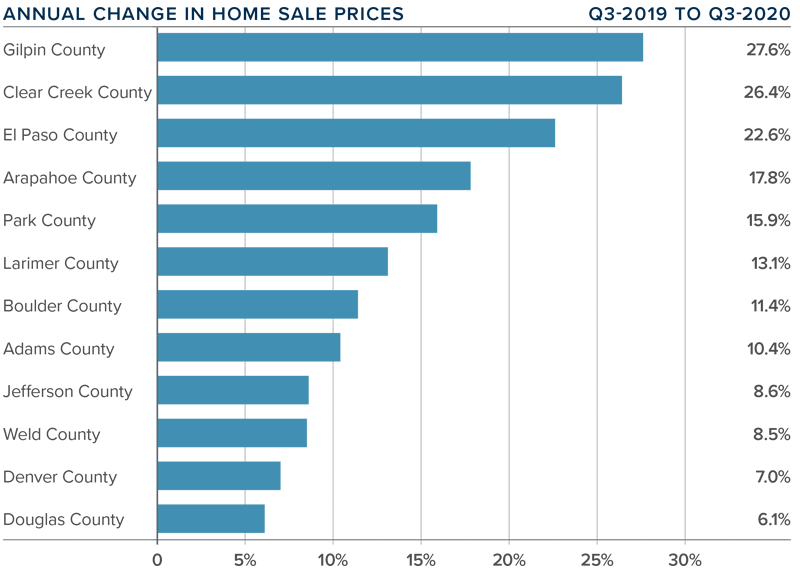
DAYS ON MARKET
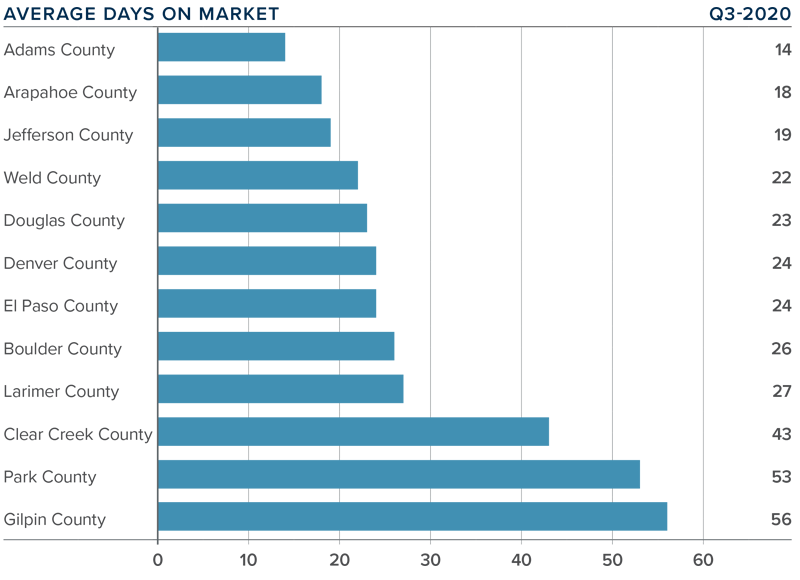
- The average number of days it took to sell a home in the markets contained in this report dropped one day compared to the third quarter of 2019.
- The amount of time it took to sell a home dropped in nine counties, remained static in two, and rose in one compared to the third quarter of 2019.
- It took an average of 29 days to sell a home in the region.
- The Colorado housing market continues to demonstrate solid demand, and the short length of time it takes to sell a home suggests buyers are competing fiercely for available inventory.
CONCLUSIONS
 This speedometer reflects the state of the region’s real estate market using housing inventory, price gains, home sales, interest rates, and larger economic factors.
Demand for housing is significant, and sales activity is only limited by the lack of available homes to buy. Prices are rising on the back of very competitive mortgage rates and a job market in recovery. I suggested in my second-quarter report that the area would experience a “brisk summer housing market” and my forecast was accurate. As such, I have moved the needle a little more in favor of home sellers.
ABOUT MATTHEW GARDNER
 As Chief Economist for Windermere Real Estate, Matthew Gardner is responsible for analyzing and interpreting economic data and its impact on the real estate market on both a local and national level. Matthew has over 30 years of professional experience both in the U.S. and U.K.
In addition to his day-to-day responsibilities, Matthew sits on the Washington State Governors Council of Economic Advisors; chairs the Board of Trustees at the Washington Center for Real Estate Research at the University of Washington; and is an Advisory Board Member at the Runstad Center for Real Estate Studies at the University of Washington where he also lectures in real estate economics.
Windermere Colorado
Gardner Report – Q3 2019


The following analysis of the Metro Denver & Northern Colorado real estate market is provided by Windermere Real Estate Chief Economist Matthew Gardner. We hope that this information may assist you with making better-informed real estate decisions. For further information about the housing market in your area, please don’t hesitate to contact your Windermere real estate agent.
ECONOMIC OVERVIEW
Colorado’s economy picked up, adding 64,900 new non-agricultural jobs over the past 12 months — a growth rate of 2.4%. Over the past three months, the state added an impressive 28,300 new jobs.
In August, the state unemployment rate was 2.8%, down from 3.4% a year ago. Unemployment rates in all the counties contained in this report were lower than a year ago. It is fair to say that all markets are now at full employment.
HOME SALES
- In the third quarter of 2019, 17,562 homes sold. This is an increase of 5.1% compared to the third quarter of 2018 but 1.6% lower than the second quarter (which can be attributed to seasonality). Pending sales — a sign of future closings —rose 9.7%, suggesting that closings in the final quarter of 2019 are likely to show further improvement.
- Seven counties contained in this report saw sales growth, while four saw sales activity drop. I am not concerned about this because all the markets that experienced slowing are relatively small and, therefore, subject to significant swings.
- I was pleased to see an ongoing increase in the number of homes for sale (+16.9%), which means home buyers have more choice and feel less urgency.
- Inventory levels are moving higher, and demand for housing appears to be quite strong. As I predicted last quarter, home sales rose in the third quarter compared to a year ago.

HOME PRICES

- Home prices continue to trend higher, with the average home price in the region rising 3.8% year-over-year to $477,776.
- Interest rates are at very competitive levels and are likely to remain below 4% for the balance of the year. As a result, prices will continue to rise but at a more modest pace.
- Appreciation was again strongest in Park County, where prices rose 7.8%. We also saw strong growth in Weld County, which rose 7.4%. Home prices dropped in Clear Creek County, but, as mentioned earlier, this is a small market so I don’t believe this is indicative of an ongoing trend.
- Affordability remains an issue in many Colorado markets and this will act as a modest headwind to ongoing price growth.

DAYS ON MARKET
- The average number of days it took to sell a home in the markets contained in this report rose seven days compared to the third quarter of 2018.
- The amount of time it took to sell a home rose in all counties compared to the third quarter of 2018.
- It took an average of 30 days to sell a home in the region — an increase of 1 day compared to the second quarter of this year.
- The Colorado housing market is still performing well, and the modest increase in the length of time it took to sell a home is a function of greater choice in homes for sale and buyers taking a little longer to choose a home.

CONCLUSIONS

This speedometer reflects the state of the region’s real estate market using housing inventory, price gains, home sales, interest rates, and larger economic factors.
For the third quarter of 2019, I continue the trend I started last summer and have moved the needle a little more in favor of buyers. I continue to closely monitor listing activity to see if we get any major bumps above the traditional increase because that may further slow home price growth. However, the trend for 2019 will continue to be a move toward a more balanced market.
ABOUT MATTHEW GARDNER

As Chief Economist for Windermere Real Estate, Matthew Gardner is responsible for analyzing and interpreting economic data and its impact on the real estate market on both a local and national level. Matthew has over 30 years of professional experience both in the U.S. and U.K.
In addition to his day-to-day responsibilities, Matthew sits on the Washington State Governors Council of Economic Advisors; chairs the Board of Trustees at the Washington Center for Real Estate Research at the University of Washington; and is an Advisory Board Member at the Runstad Center for Real Estate Studies at the University of Washington where he also lectures in real estate economics.
